




Outline
- Introduction
- What is Redash?
- How Redash Works
- Key Benefits of Using Redash
- Supported Data Sources
- Building Dashboards and Visualizations
- Collaboration and Sharing Features
- Alternatives to Redash
- Use Cases Across Industries
- Community and Open Source Contributions
- Conclusion
Introduction
In today’s data-driven world, organizations rely heavily on analytics to make informed decisions. However, accessing and visualizing data from multiple sources can be challenging. This is where Redash comes into play. Redash is an open-source data visualization and collaboration tool designed to simplify the process of querying, visualizing, and sharing data insights across teams. It bridges the gap between raw data and actionable intelligence, making it a favorite among data analysts, engineers, and business professionals.
What is Redash?
Redash is a browser-based platform that allows users to connect to various data sources, run queries, and create interactive dashboards. Originally developed by Arik Fraimovich in 2013, Redash quickly gained popularity for its simplicity and flexibility. It was later acquired by Databricks in 2020, further enhancing its integration capabilities with modern data ecosystems. The tool’s open-source nature encourages community contributions, making it continuously evolve with new features and improvements.
How Redash Works
Redash operates on a straightforward principle: connect, query, visualize, and share. Users can connect Redash to multiple databases and APIs, write SQL or NoSQL queries, and visualize the results in a variety of chart types. The platform supports scheduling queries for automatic data refreshes, ensuring dashboards always display up-to-date information. Additionally, Redash offers an API for programmatic access, enabling integration with other applications and workflows.
Core Workflow
- Connect: Link Redash to your preferred data sources, including relational databases, cloud storage, and APIs.
- Query: Use the built-in SQL editor to write and execute queries efficiently.
- Visualize: Create charts, tables, and dashboards to represent your data visually.
- Share: Collaborate with team members by sharing dashboards or embedding them in other platforms.
Key Benefits of Using Redash
Redash offers numerous advantages that make it a go-to solution for data teams:
- Ease of Use: Its intuitive interface allows even non-technical users to explore data effortlessly.
- Collaboration: Teams can share queries and dashboards, promoting transparency and data-driven culture.
- Customizability: As an open-source tool, Redash can be tailored to meet specific organizational needs.
- Integration: Redash supports a wide range of data sources, making it adaptable for diverse data environments.
- Automation: Scheduled queries and alerts help teams stay updated with minimal manual intervention.
Supported Data Sources
One of Redash’s strongest features is its ability to connect to a wide variety of data sources. It supports SQL, NoSQL, Big Data, and API-based data connections. This flexibility allows organizations to centralize their analytics efforts without switching between multiple tools.
Commonly Supported Data Sources
- PostgreSQL
- MySQL
- Amazon Redshift
- Google BigQuery
- MongoDB
- Elasticsearch
- Google Sheets
- Snowflake
- Presto
- API-based data sources
Building Dashboards and Visualizations
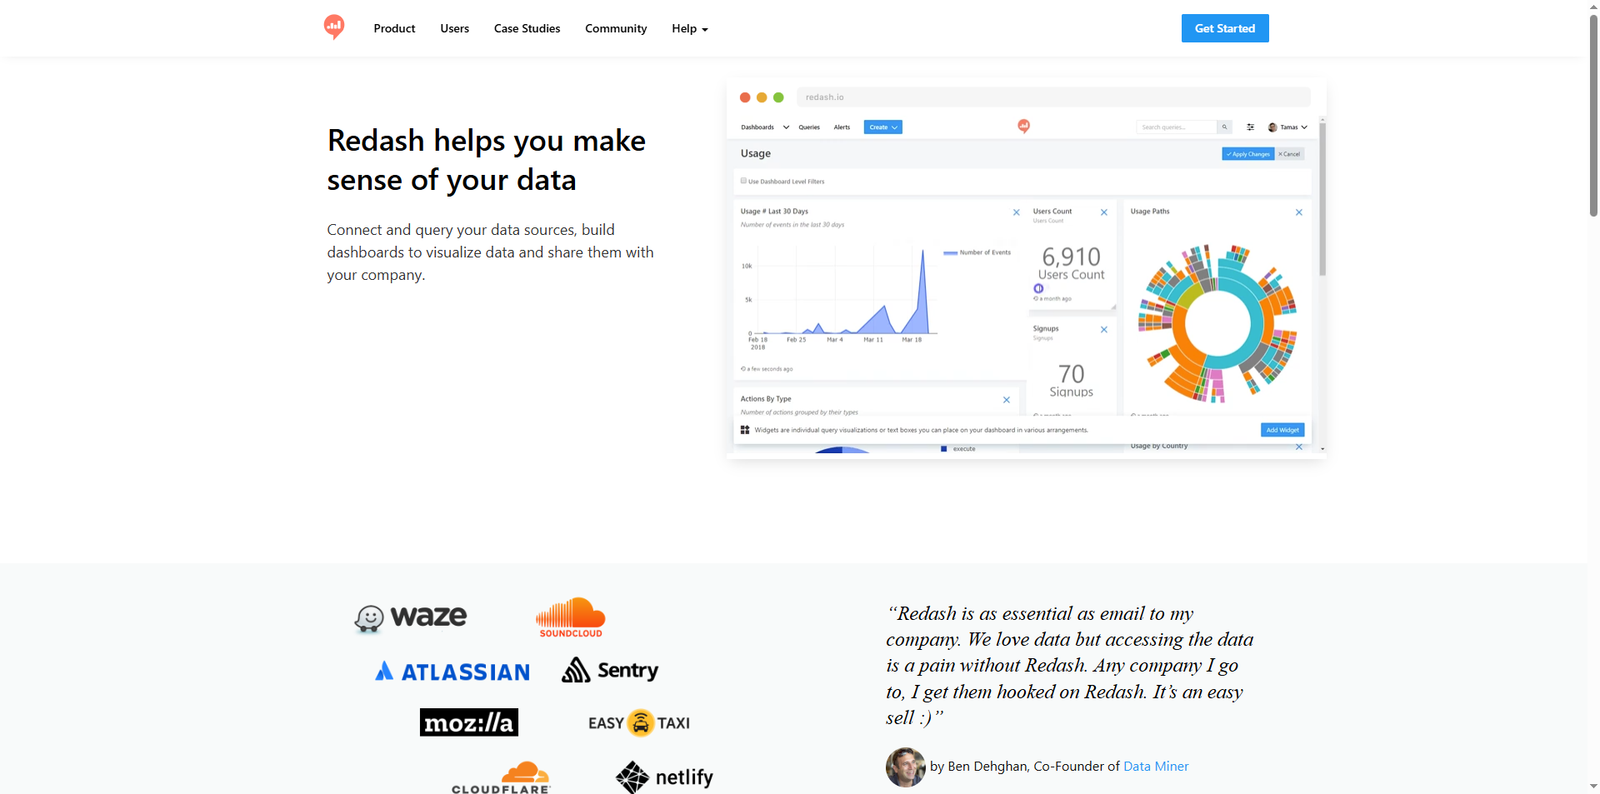
Redash provides a drag-and-drop interface for building dashboards that display multiple visualizations side by side. Users can choose from charts, tables, maps, and pivot tables to represent data effectively. Dashboards can be resized, rearranged, and customized to highlight key metrics.
Visualization Types
- Line and bar charts for trend analysis
- Pie charts for categorical comparisons
- Heatmaps for density visualization
- Pivot tables for multi-dimensional data analysis
- Geospatial maps for location-based insights
Each visualization can be linked to live queries, ensuring that dashboards automatically update as new data becomes available. This real-time capability is especially valuable for monitoring business performance and operational metrics.
Collaboration and Sharing Features
Redash emphasizes collaboration by allowing users to share dashboards and query results easily. Teams can comment on queries, reuse snippets, and maintain a shared workspace for analytics projects. Dashboards can also be made public or embedded in internal tools, promoting transparency across departments.
Collaboration Highlights
- Shared query libraries for consistent analytics practices
- Role-based access control for secure data management
- Public and private dashboard sharing options
- Integration with alerting systems to notify teams of data changes
Alternatives to Redash
While Redash is a powerful tool, several other platforms offer similar capabilities. Below is a comparison of popular alternatives that organizations may consider:
| Tool Name | Description |
|---|---|
| Metabase | An open-source business intelligence tool that allows users to create dashboards and visualizations without writing SQL queries. |
| Looker | A modern data platform that enables teams to explore, share, and visualize data through a semantic modeling layer. |
| Tableau | A leading data visualization tool known for its interactive dashboards and enterprise-level analytics capabilities. |
| Power BI | Microsoft’s analytics service that provides interactive visualizations and business intelligence capabilities. |
| Apache Superset | An open-source data exploration and visualization platform designed for modern data workflows. |
Use Cases Across Industries
Redash’s versatility makes it suitable for a wide range of industries and business functions. From startups to large enterprises, organizations use Redash to gain insights and improve decision-making processes.
Common Use Cases
- Marketing Analytics: Track campaign performance and customer engagement metrics in real time.
- Product Analytics: Monitor user behavior and feature adoption to guide product development.
- Financial Reporting: Consolidate financial data from multiple systems for accurate reporting.
- Operations Management: Visualize supply chain data to identify bottlenecks and optimize processes.
- Data Engineering: Build reusable queries and dashboards for data validation and monitoring.
For example, a SaaS company might use Redash to combine data from PostgreSQL and Google Analytics, creating a unified dashboard that tracks user acquisition, retention, and revenue growth. This holistic view enables teams to make data-backed decisions faster.
Community and Open Source Contributions
As an open-source project, Redash thrives on community involvement. Developers worldwide contribute to its codebase, improving stability, adding integrations, and enhancing user experience. The community also provides plugins, tutorials, and troubleshooting support, making it easier for new users to get started.
Redash’s open-source license ensures there’s no vendor lock-in, giving organizations the freedom to host and customize the platform as needed. This flexibility has made it a preferred choice for companies that value transparency and control over their analytics infrastructure.
Conclusion
Redash stands out as a powerful, flexible, and user-friendly data visualization tool that empowers teams to make sense of their data. Its ability to connect to multiple data sources, create interactive dashboards, and foster collaboration makes it an invaluable asset for data-driven organizations. Whether you’re a small startup or a large enterprise, Redash provides the foundation for building a culture of analytics and informed decision-making. With its open-source nature and active community, Redash continues to evolve, ensuring it remains a reliable choice for modern data teams seeking clarity and insight from their data.