




Outline
- Introduction
- What Is Observable?
- How Observable Transforms Data Analysis
- Key Advantages of Using Observable
- Collaboration and Community
- Integration and Workflow
- Popular Use Cases
- Alternatives to Observable
- Conclusion
Introduction
In the modern data-driven world, professionals rely on tools that not only visualize data but also foster collaboration and interactivity. Observable is one such platform that has redefined how teams work with data. It combines live coding, visualization, and sharing capabilities into a single, browser-based environment. This article explores Observable’s purpose, how it enhances data workflows, and what makes it a standout choice for analysts, developers, and data scientists.
What Is Observable?
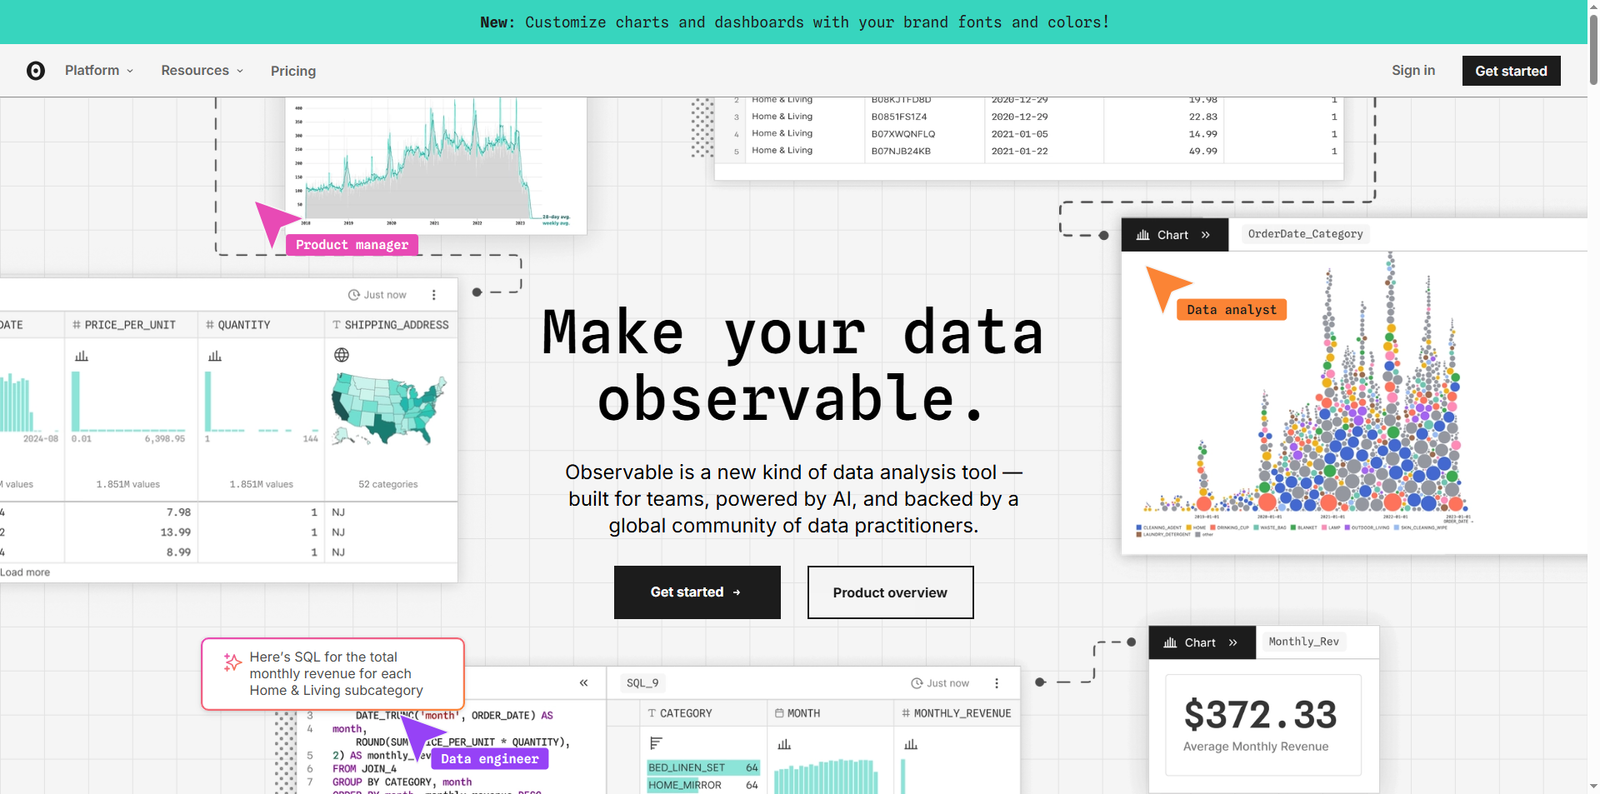
Observable is an interactive data notebook platform that allows users to create, share, and collaborate on data visualizations directly in the browser. Founded by Mike Bostock, the creator of D3.js, Observable builds upon the principles of open collaboration and reproducible research. It provides a JavaScript-based environment where code, data, and visual output coexist seamlessly, making it ideal for exploring datasets and building dashboards.
Unlike traditional notebooks that rely on static outputs, Observable notebooks are reactive. This means that when a user updates a variable or dataset, all dependent visualizations automatically refresh in real time. This dynamic interactivity makes data exploration faster and more intuitive.
How Observable Transforms Data Analysis
Observable’s approach to data analysis emphasizes transparency and collaboration. Instead of isolated scripts or static reports, users can create living documents that evolve with the data. The platform supports JavaScript, HTML, and Markdown, allowing analysts to integrate code and commentary fluidly.
Observable’s reactive runtime enables users to see immediate results of their code changes, which is particularly useful for iterative analysis. Teams can experiment with different data transformations, test hypotheses, and visualize outcomes instantly without switching between tools.
Key Advantages of Using Observable
1. Real-Time Collaboration
Observable supports real-time collaboration similar to how Google Docs allows multiple users to edit simultaneously. Team members can view each other’s changes, comment on specific cells, and co-develop visualizations. This feature is especially beneficial for distributed teams working on shared data projects.
2. Seamless Integration with Data Sources
Observable can connect to various data sources, including APIs, CSV files, and databases. Users can import data directly from cloud storage or public datasets, making it easier to build visualizations without complex setup.
3. Browser-Based Environment
Because Observable runs entirely in the browser, there’s no need for installation or configuration. Users can start coding immediately, which reduces technical barriers and encourages experimentation. This accessibility has made Observable popular among educators, journalists, and researchers who need quick, shareable insights.
4. Community-Driven Ecosystem
Observable’s community is one of its strongest assets. Thousands of public notebooks are available for learning, inspiration, and reuse. Users can fork existing notebooks, modify them, and share improvements, fostering a culture of open collaboration. According to Observable’s public metrics, the platform hosts over 200,000 notebooks contributed by a global network of data practitioners.
Collaboration and Community
Observable’s collaborative model extends beyond internal teams. The public community serves as a knowledge base where users can explore examples, tutorials, and templates. This ecosystem accelerates learning and promotes best practices in data visualization and analysis.
For instance, journalists use Observable to create interactive stories that engage readers, while researchers use it to publish reproducible analyses. The platform’s combination of code transparency and visual storytelling makes it a valuable tool for communicating complex information effectively.
Integration and Workflow
Observable integrates smoothly into existing workflows. Users can embed notebooks into websites, export visualizations as static images, or connect them to other tools via APIs. This flexibility ensures that Observable fits into diverse data ecosystems, from academic research to enterprise analytics.
Developers can also use Observable’s runtime library to embed live visualizations in web applications. This capability allows organizations to maintain interactive dashboards that update automatically as data changes.
Integration Examples
- Connecting to cloud data warehouses for real-time analytics.
- Embedding interactive charts in content management systems.
- Using Observable notebooks as prototypes for production dashboards.
- Integrating with version control systems for collaborative development.
Popular Use Cases
Observable’s versatility makes it suitable for a wide range of applications. Below are some common scenarios where teams leverage its capabilities:
Data Journalism
Media organizations use Observable to create interactive visual stories that help readers understand complex datasets. For example, The New York Times and The Guardian have used similar notebook-based workflows to produce engaging data-driven articles.
Education and Research
Educators use Observable to teach data visualization, statistics, and programming. Its live-editing environment allows students to experiment with code and instantly see results, reinforcing learning through interactivity.
Business Intelligence
Companies use Observable to build internal dashboards that visualize key performance indicators. Because notebooks can pull data from APIs or databases, teams can monitor metrics in real time without relying on static reports.
Prototyping and Development
Developers often use Observable as a sandbox for testing visualization ideas before implementing them in production. The ability to share notebooks easily accelerates feedback and iteration cycles.
Alternatives to Observable
While Observable offers a unique combination of interactivity and collaboration, several other tools also support data visualization and analysis. The table below highlights some popular alternatives that teams may consider depending on their needs.
| Tool Name | Description |
|---|---|
| Jupyter Notebook | A widely used open-source environment for Python-based data analysis and visualization, supporting multiple programming languages through kernels. |
| Google Colab | A cloud-hosted notebook environment that allows users to write and execute Python code in the browser with free access to computing resources. |
| Tableau | A leading data visualization platform that enables users to create interactive dashboards and share insights across organizations. |
| Power BI | Microsoft’s business analytics service that provides interactive visualizations and business intelligence capabilities with an intuitive interface. |
| Looker Studio | A Google tool that helps users create customizable data reports and dashboards by connecting to multiple data sources. |
Conclusion
Observable represents a significant evolution in how teams approach data visualization and analysis. By combining interactivity, collaboration, and accessibility, it bridges the gap between coding and communication. Its reactive notebooks empower users to explore data dynamically, while its community-driven ecosystem fosters innovation and knowledge sharing.
Whether you are a data scientist seeking a more interactive workflow, an educator teaching visualization concepts, or a journalist creating data-driven stories, Observable provides a flexible and powerful environment to bring your ideas to life. As data continues to shape decision-making across industries, platforms like Observable will remain at the forefront of enabling transparent, collaborative, and insightful analysis.