



Outline
- Introduction
- What is Mode?
- How Mode Empowers Data Teams
- Core Capabilities of Mode
- Integration with the Modern Data Stack
- Benefits of Using Mode
- Alternatives to Mode
- Real-World Use Cases
- Conclusion
Introduction
In today’s data-driven world, organizations rely heavily on business intelligence (BI) tools to make informed decisions. Mode stands out as a collaborative analytics platform that bridges the gap between data teams and business users. Designed to unify SQL, R, Python, and visualization in one environment, Mode enables companies to transform raw data into actionable insights faster than ever. This article explores what Mode is, how it works, and why it’s a leading choice for modern data teams.
What is Mode?
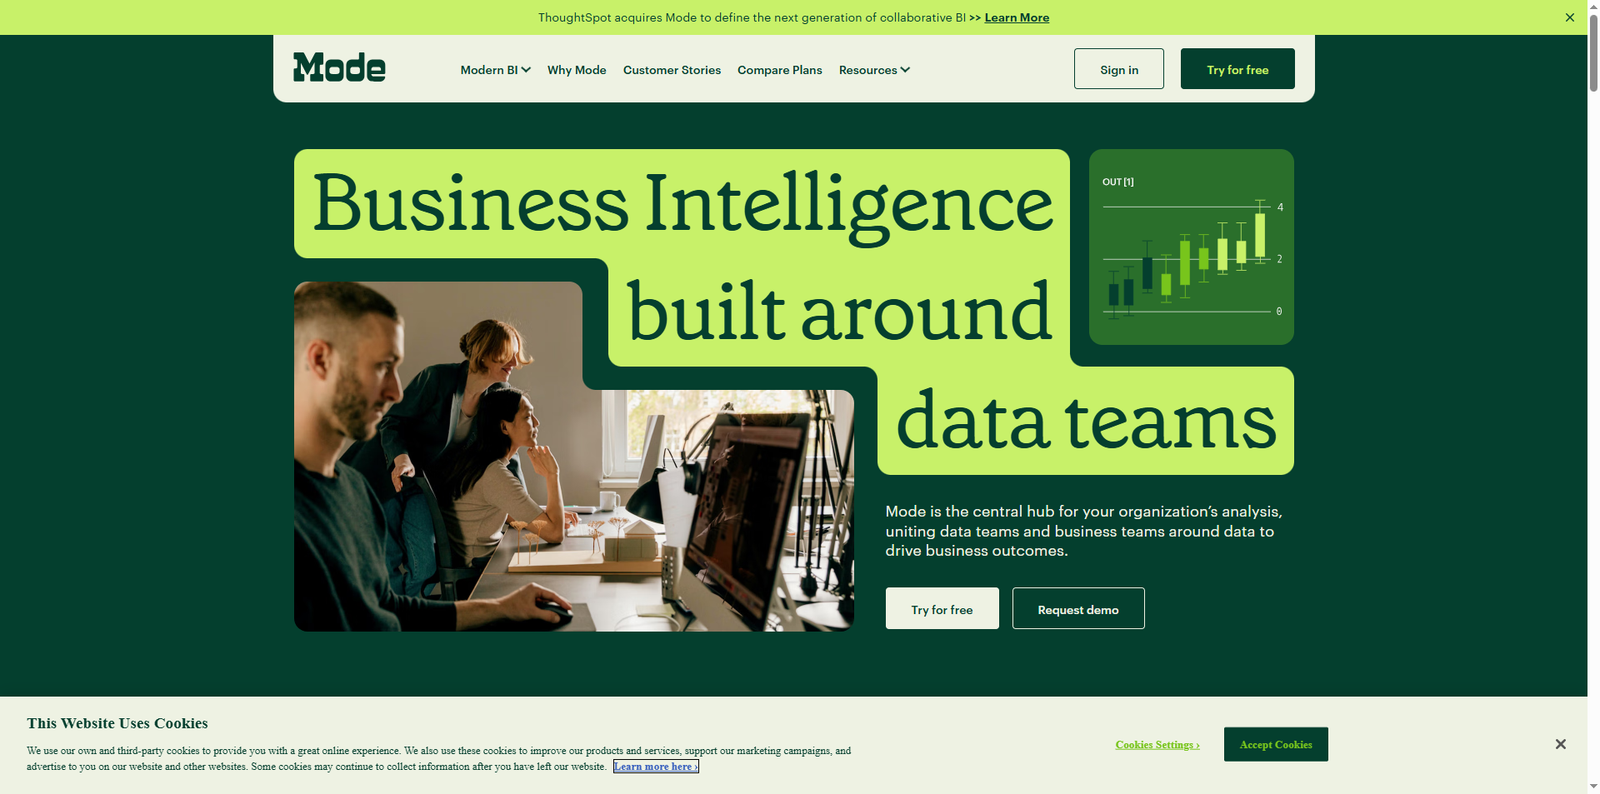
Mode is a business intelligence and analytics platform built around the needs of data teams. It provides a centralized hub for analysis, allowing users to query data directly using SQL, perform advanced analytics with R or Python, and create interactive dashboards for business users. Founded in 2013, Mode has grown into a trusted tool for organizations seeking to democratize data access and streamline collaboration between technical and non-technical teams.
According to Mode’s official information, the platform serves as an “intelligence layer for the modern data stack”, amplifying the value of existing data infrastructure by making insights accessible across the organization. It integrates seamlessly with popular data warehouses like Snowflake, BigQuery, and Redshift, ensuring that teams can analyze live data without complex setup or maintenance.
How Mode Empowers Data Teams
Mode’s design philosophy centers on empowering data professionals to work efficiently while enabling business users to explore insights independently. The platform connects technical analysis with interactive reporting, ensuring that everyone—from analysts to executives—can make data-informed decisions.
Unified Analytics Environment
Mode combines SQL, R, and Python in one workspace. Analysts can write SQL queries to extract data, then use R or Python notebooks for advanced modeling or visualization. This integration eliminates the need to switch between multiple tools, streamlining workflows and reducing friction in the analytics process.
Collaboration and Sharing
One of Mode’s standout features is its collaborative environment. Analysts can share reports, dashboards, and data apps with stakeholders, who can then interact with the data through filters and parameters. This promotes transparency and encourages data-driven discussions across departments.
Core Capabilities of Mode
Mode offers a range of capabilities designed to support both technical and non-technical users. These include:
- Ad Hoc Analysis: Quickly explore data using SQL queries and iterate through results in real time.
- Advanced Analytics: Integrate R and Python scripts for statistical modeling, forecasting, and machine learning.
- Interactive Dashboards: Build dynamic dashboards that update automatically as data changes.
- Self-Service Reporting: Empower business users to explore curated datasets without relying on analysts for every request.
- Reusable Datasets: Create and share datasets that can be reused across multiple reports, ensuring consistency and accuracy.
Integration with the Modern Data Stack
Mode is designed to fit seamlessly into the modern data ecosystem. It connects directly to cloud data warehouses, data lakes, and transformation tools, allowing organizations to leverage their existing infrastructure. The typical data flow includes ingestion, transformation, storage, and analysis—all of which Mode supports as the final layer for insight generation.
Supported Integrations
Mode integrates with leading data platforms, including:
- Snowflake
- Google BigQuery
- Amazon Redshift
- Databricks
- PostgreSQL
These integrations ensure that Mode users can query live data directly from their warehouses, eliminating the need for data extracts or manual updates. This real-time connectivity enhances accuracy and speeds up decision-making.
Benefits of Using Mode
Organizations that adopt Mode experience several key benefits that enhance their data culture and operational efficiency.
1. Faster Insights
By combining SQL, R, and Python in one environment, Mode reduces the time it takes to move from raw data to insights. Analysts can perform complex analyses and share results instantly, accelerating the decision-making process.
2. Improved Collaboration
Mode’s collaborative workspace encourages teamwork between data analysts and business stakeholders. Everyone can access the same reports, comment on findings, and explore data interactively, fostering alignment across teams.
3. Scalability and Flexibility
Mode scales with organizational needs, supporting small teams as well as enterprise-level deployments. Its flexible architecture allows integration with various data sources, ensuring adaptability as data ecosystems evolve.
4. Enhanced Data Governance
Through reusable datasets and centralized management, Mode ensures consistency and accuracy in reporting. Data teams can curate trusted datasets, reducing redundancy and minimizing the risk of errors.
Alternatives to Mode
While Mode is a powerful BI platform, several alternatives offer similar capabilities. The following table lists some popular options for comparison:
| Tool Name | Description |
|---|---|
| Looker | A Google Cloud-based BI tool that enables data exploration and visualization through a semantic modeling layer. |
| Tableau | A leading data visualization platform known for its intuitive drag-and-drop interface and interactive dashboards. |
| Power BI | Microsoft’s analytics service that connects to multiple data sources and provides robust visualization capabilities. |
| Metabase | An open-source BI tool that allows teams to visualize and share data easily without extensive technical knowledge. |
| Sisense | A comprehensive analytics platform that embeds data insights directly into business applications. |
Real-World Use Cases
Mode is trusted by organizations across industries, from technology startups to large enterprises. Its flexibility and collaborative features make it suitable for various analytical applications.
Marketing Analytics
Marketing teams use Mode to track campaign performance, analyze customer acquisition costs, and measure ROI. By connecting directly to marketing data sources, analysts can build dashboards that provide real-time insights into campaign effectiveness.
Product Analytics
Product managers rely on Mode to monitor user behavior, feature adoption, and retention metrics. The ability to combine SQL queries with Python analysis allows teams to uncover patterns and optimize product strategies.
Financial Reporting
Finance departments use Mode to automate reporting processes, track revenue trends, and forecast performance. The platform’s integration with data warehouses ensures that financial data remains accurate and up to date.
Operations and Supply Chain
Operations teams leverage Mode to monitor logistics, inventory levels, and supplier performance. Real-time dashboards help identify bottlenecks and improve efficiency across the supply chain.
Conclusion
Mode has established itself as a cornerstone of modern business intelligence by uniting data teams and business users around a shared analytical environment. Its combination of SQL, R, and Python capabilities, along with interactive dashboards and self-service reporting, makes it an indispensable tool for organizations seeking to harness the full power of their data. By integrating seamlessly with the modern data stack, Mode ensures that insights flow effortlessly from data warehouses to decision-makers. Whether you’re a data analyst, a business leader, or a developer, Mode provides the flexibility and collaboration needed to transform data into strategic advantage. As companies continue to prioritize data-driven decision-making, Mode remains a leading choice for building a truly connected analytics ecosystem.