


Outline
- Introduction
- What is Looker?
- How Looker Transforms Data Analytics
- Core Components of Looker’s Platform
- Benefits of Using Looker for Business Intelligence
- Real-World Applications of Looker
- Integration Capabilities and Ecosystem
- Alternatives to Looker
- Conclusion
Introduction
In today’s data-driven economy, organizations rely on analytics platforms to make informed decisions and gain a competitive edge. Looker, now part of Google Cloud, has emerged as a leading business intelligence (BI) and data exploration platform that enables companies to visualize, analyze, and share insights seamlessly. According to Google Cloud’s 2023 report, more than 2,000 enterprises use Looker to unify their data and drive smarter business outcomes. This article explores what makes Looker a powerful analytics solution, how it integrates with modern data ecosystems, and what alternatives businesses can consider.
What is Looker?
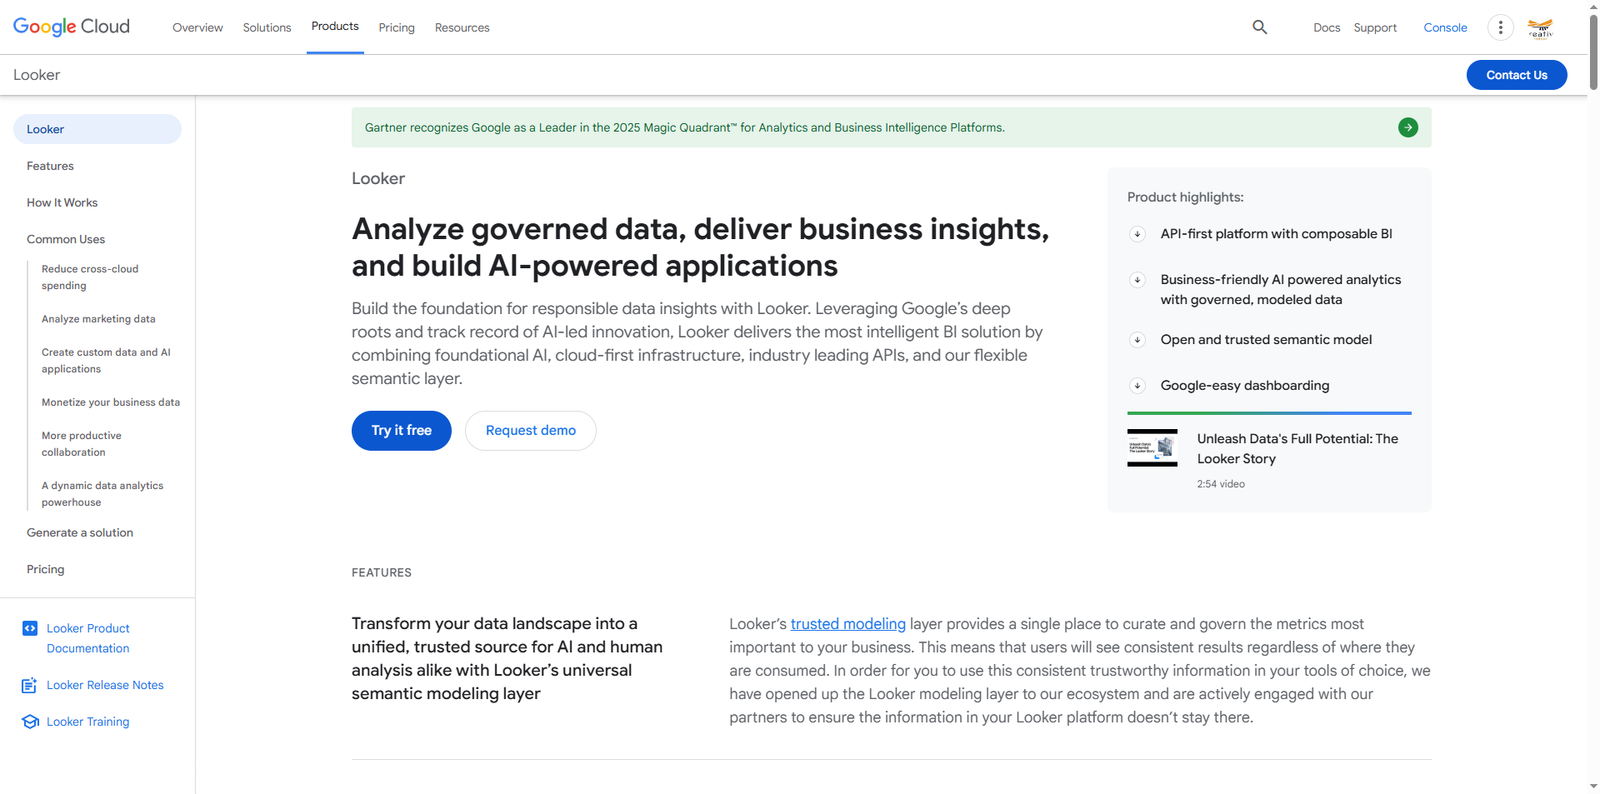
Looker is a modern BI and analytics platform that connects directly to databases, allowing users to explore real-time data without the need for complex data extraction. It leverages a modeling language called LookML to define data relationships, ensuring consistent metrics across teams. By combining data modeling, visualization, and collaboration, Looker turns raw data into actionable insights accessible to both technical and non-technical users.
Launched in 2012 and acquired by Google Cloud in 2020, Looker has evolved into a central hub for analytics, supporting cloud-native environments and integrating with Google’s AI and machine learning tools. Its flexibility and scalability make it suitable for organizations of all sizes across industries.
How Looker Transforms Data Analytics
Traditional BI tools often require data extraction and transformation before analysis. Looker eliminates this bottleneck through its in-database architecture, which queries data directly where it resides. This approach ensures accuracy, reduces latency, and enhances collaboration across departments.
Looker’s integration with BigQuery and other data warehouses like Snowflake and Redshift allows businesses to analyze massive datasets efficiently. Its AI-powered features, accessible through Looker AI, enable predictive analytics, natural language querying, and automated insights generation, making data exploration more intuitive than ever.
Core Components of Looker’s Platform
1. LookML Data Modeling
LookML is Looker’s proprietary modeling language that defines data relationships and metrics in a reusable, version-controlled format. It ensures that all users access consistent definitions of KPIs, reducing discrepancies and improving trust in analytics.
2. Data Visualization and Dashboards
Looker provides interactive dashboards that allow users to visualize data through charts, tables, and maps. These dashboards can be customized and embedded into other applications, enabling real-time decision-making across teams.
3. Embedded Analytics
Organizations can embed Looker’s analytics into their own products or internal portals, offering customers or employees direct access to insights without switching platforms. This capability supports white-label analytics and enhances user engagement.
4. Collaboration and Sharing
Looker integrates with collaboration tools like Google Workspace and Slack, allowing teams to share dashboards, schedule reports, and discuss insights directly within their workflow.
Benefits of Using Looker for Business Intelligence
Looker’s architecture and design philosophy bring several advantages to organizations seeking to modernize their analytics operations:
- Unified Data Access: Looker connects directly to multiple databases, ensuring that all teams work from a single source of truth.
- Scalability: Its cloud-native infrastructure supports large-scale data operations without performance degradation.
- Data Governance: Centralized data modeling ensures compliance and consistency across departments.
- AI Integration: Looker AI enhances analytics with predictive modeling and natural language processing.
- Customizable Dashboards: Users can tailor dashboards to specific roles or business units, improving relevance and usability.
Real-World Applications of Looker
Looker’s versatility makes it valuable across industries. Here are some examples of how organizations leverage its capabilities:
- Retail: Retailers use Looker to analyze customer behavior, optimize inventory, and forecast demand. For instance, e-commerce companies can track conversion rates and identify high-performing products in real time.
- Healthcare: Hospitals and research institutions utilize Looker to analyze patient outcomes, streamline operations, and ensure compliance with healthcare regulations.
- Finance: Financial institutions rely on Looker for risk analysis, fraud detection, and portfolio performance tracking.
- Marketing: Marketing teams use Looker to measure campaign performance, track ROI, and segment audiences for personalized outreach.
- Manufacturing: Manufacturers apply Looker analytics to monitor production efficiency, supply chain performance, and equipment maintenance schedules.
Integration Capabilities and Ecosystem
Looker’s strength lies in its ability to integrate seamlessly with a wide range of data sources, cloud services, and third-party tools. It supports SQL-based databases, cloud data warehouses, and APIs, enabling flexible data connectivity.
Some of the most common integrations include:
- BigQuery for scalable cloud analytics
- Snowflake for cloud data warehousing
- Amazon Redshift for enterprise data storage
- Databricks for data engineering and AI workflows
- Tableau and Power BI for advanced visualization
Looker also integrates with machine learning models through Google Cloud’s Vertex AI, allowing organizations to operationalize predictive analytics directly within their dashboards. This integration bridges the gap between data science and business intelligence, enabling faster and more informed decision-making.
Alternatives to Looker
While Looker is a robust analytics platform, businesses may explore other tools depending on their specific needs, infrastructure, and technical expertise. Below is a comparison table of popular alternatives:
| Tool Name | Description |
|---|---|
| Tableau | A leading data visualization platform known for its intuitive drag-and-drop interface and strong community support. |
| Power BI | Microsoft’s BI tool that integrates seamlessly with Office 365 and Azure, offering robust reporting and dashboard capabilities. |
| Qlik Sense | A self-service analytics solution that uses associative data modeling to uncover hidden insights across datasets. |
| Domo | A cloud-based platform combining data integration, visualization, and collaboration in one environment. |
| Sisense | An end-to-end analytics solution that allows embedding analytics into applications and workflows with ease. |
Conclusion
Looker stands out as a transformative analytics platform that empowers organizations to harness the full potential of their data. By combining real-time querying, flexible modeling, and AI-driven insights, it bridges the gap between data teams and business users. Its integration with Google Cloud’s ecosystem further enhances scalability, security, and innovation potential.
For businesses seeking to modernize their analytics infrastructure, Looker offers a unified approach to data exploration and decision-making. However, evaluating alternatives like Tableau, Power BI, or Qlik Sense can help identify the best fit for specific organizational goals. Ultimately, the right BI platform is one that aligns with your data strategy, supports collaboration, and drives measurable business outcomes.
As data continues to shape the future of business, tools like Looker will remain essential in helping organizations turn information into insight, and insight into action.