





Outline
- Introduction
- What is Grafana?
- How Grafana Works
- Key Components of Grafana
- Benefits of Using Grafana
- Common Use Cases
- Integrations and Supported Data Sources
- Alternatives to Grafana
- Getting Started with Grafana
- Conclusion
Introduction
In today’s data-driven world, organizations rely heavily on monitoring and visualization tools to make sense of complex metrics and logs. Grafana has become one of the most popular open-source platforms for visualizing time-series data, enabling teams to monitor systems, analyze performance, and gain actionable insights. With its flexibility, extensibility, and active community, Grafana is a go-to solution for DevOps engineers, data analysts, and IT professionals worldwide.
What is Grafana?
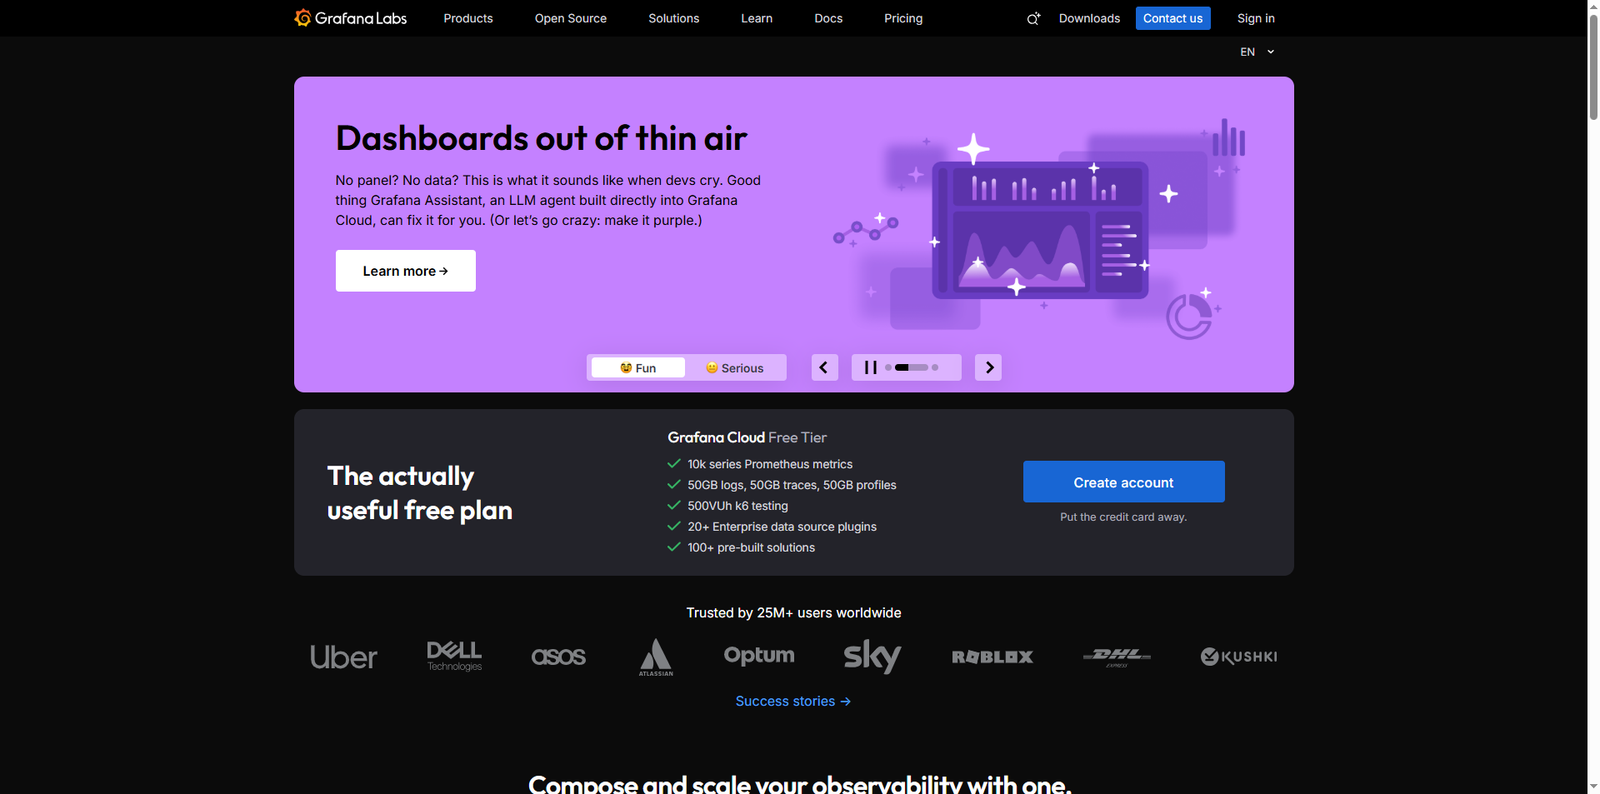
Grafana is an open-source analytics and visualization platform designed to help users query, visualize, and understand their metrics from multiple data sources. Originally developed by Torkel Ödegaard in 2014, Grafana has evolved into a full-stack observability platform. It allows users to create dashboards that visualize data from sources such as Prometheus, InfluxDB, Elasticsearch, and many others. Grafana Labs, the company behind the project, also offers Grafana Cloud, a managed service that simplifies deployment and scaling.
How Grafana Works
Grafana operates by connecting to various data sources and transforming the retrieved data into interactive visualizations. Users can define queries using each data source’s native language, and Grafana renders the results into charts, graphs, and tables. Dashboards can be customized with panels, variables, and alerting rules, allowing teams to monitor key metrics in real time.
Grafana supports both on-premises and cloud deployments. The open-source version can be installed on Linux, macOS, or Windows, while Grafana Cloud provides a fully managed environment with automatic updates, scaling, and integrated observability tools.
Key Components of Grafana
1. Dashboards
Dashboards are the core of Grafana’s visualization capabilities. They consist of panels that display data in various formats such as line graphs, bar charts, heatmaps, and gauges. Users can create dynamic dashboards using variables, making it easy to filter and compare data across multiple dimensions.
2. Data Sources
Grafana connects to a wide range of data sources, from time-series databases to cloud monitoring services. Each data source type has its own query editor that helps users build queries efficiently. Popular integrations include Prometheus, Loki, Elasticsearch, and MySQL.
3. Alerting
Grafana’s alerting system enables teams to set up notifications based on specific conditions. Alerts can be sent via email, Slack, PagerDuty, or other communication channels. This feature ensures that teams are promptly informed of anomalies or performance issues.
4. Plugins
Grafana’s extensibility is one of its strongest features. Through plugins, users can add new data sources, visualization types, and app integrations. The Grafana plugin ecosystem includes hundreds of community and enterprise plugins that extend its functionality.
Benefits of Using Grafana
Grafana offers numerous advantages that make it a preferred choice for monitoring and analytics:
- Unified Visualization: Grafana consolidates data from multiple sources into a single dashboard, providing a unified view of system health and performance.
- Customizable Dashboards: Users can tailor dashboards to their specific needs, adjusting layouts, colors, and visualization types.
- Open Source and Extensible: Being open source, Grafana allows developers to modify and extend its capabilities according to their requirements.
- Community Support: Grafana’s large and active community contributes plugins, tutorials, and troubleshooting advice, ensuring continuous improvement.
- Scalability: Grafana can handle large-scale environments, making it suitable for enterprises and startups alike.
Common Use Cases
Grafana is used across various industries and technical domains. Some of the most common use cases include:
- Infrastructure Monitoring: DevOps teams use Grafana to monitor servers, containers, and networks in real time.
- Application Performance Monitoring (APM): Developers visualize metrics from APM tools to track response times, error rates, and throughput.
- Business Intelligence: Grafana dashboards can display KPIs and business metrics, helping decision-makers analyze trends.
- IoT Data Visualization: Grafana can visualize sensor data from IoT devices, providing insights into environmental or operational conditions.
- Security Monitoring: Security teams use Grafana to analyze logs and detect anomalies in real time.
Integrations and Supported Data Sources
Grafana’s strength lies in its ability to integrate with a wide range of data sources. It supports over 100 integrations, including popular databases and monitoring tools. Below is a table highlighting some of the most commonly used data sources:
| Data Source | Description |
|---|---|
| Prometheus | A leading open-source monitoring system that collects metrics from configured targets at specified intervals. |
| Elasticsearch | A distributed search and analytics engine commonly used for log and event data analysis. |
| InfluxDB | A time-series database optimized for fast, high-availability storage and retrieval of time-stamped data. |
| Loki | A log aggregation system designed to work seamlessly with Grafana, focusing on efficiency and scalability. |
| MySQL | A widely used relational database that can be queried directly from Grafana dashboards. |
Alternatives to Grafana
While Grafana is a powerful tool, several alternatives offer similar visualization and monitoring capabilities. Below is a list of notable alternatives:
| Tool Name | Description |
|---|---|
| Datadog | A cloud-based monitoring platform that provides observability across infrastructure, applications, and logs. |
| Zabbix | An open-source monitoring solution for networks, servers, and applications with extensive alerting capabilities. |
| Kibana | A visualization tool for Elasticsearch data, offering dashboards and search capabilities for log analytics. |
| New Relic | A performance monitoring platform that provides insights into application performance and user experience. |
| Splunk | A platform for searching, monitoring, and analyzing machine-generated data in real time. |
Getting Started with Grafana
Setting up Grafana is straightforward. Users can either install it locally or sign up for Grafana Cloud. The installation process involves downloading the appropriate package, starting the Grafana server, and accessing the web interface via a browser. Once logged in, users can add data sources, create dashboards, and start visualizing metrics.
Grafana’s user interface is intuitive, featuring drag-and-drop panels and real-time previews. The platform also supports role-based access control, ensuring that only authorized users can modify dashboards or configurations. For teams adopting Infrastructure as Code (IaC), Grafana can be integrated with tools like Terraform for automated provisioning.
Conclusion
Grafana stands out as a versatile and powerful visualization platform that empowers organizations to make data-driven decisions. Its open-source nature, extensive integration capabilities, and strong community support make it a cornerstone of modern observability stacks. Whether you are monitoring cloud infrastructure, analyzing business metrics, or visualizing IoT data, Grafana provides the flexibility and scalability needed to turn raw data into actionable insights. As organizations continue to embrace digital transformation, tools like Grafana will remain essential for maintaining visibility, reliability, and performance across complex systems.